The business question
Attrition is expensive. Replacing an employee costs somewhere between half and two times that employee’s annual salary depending on the role, and that figure ignores the soft costs — institutional knowledge walking out the door, team disruption, and the months it takes a new hire to reach full productivity. So the question for any HR leader looking at a 16% company-wide attrition rate isn’t whether to act, it’s where to act first.
This analysis works through that question using the IBM HR Analytics Employee Attrition dataset: 1,470 employee records across 35 variables. The goal isn’t to predict who will leave next — it’s to identify which employee segments are leaving at meaningfully elevated rates and what operational changes would have the highest leverage.
The data
The dataset was clean to start with: 1,470 records, no missing values across any of the 35 variables. Three columns turned out to be constants (EmployeeCount, StandardHours, Over18) and were excluded from analysis. The two key categorical variables — Attrition and OverTime — were encoded as numeric dummies (1/0) so I could compute group means as rates rather than counts.
The base rate for the company is 16% annual attrition. Anything substantially above that is where the leverage is.
Finding 1: Attrition is concentrated in three roles
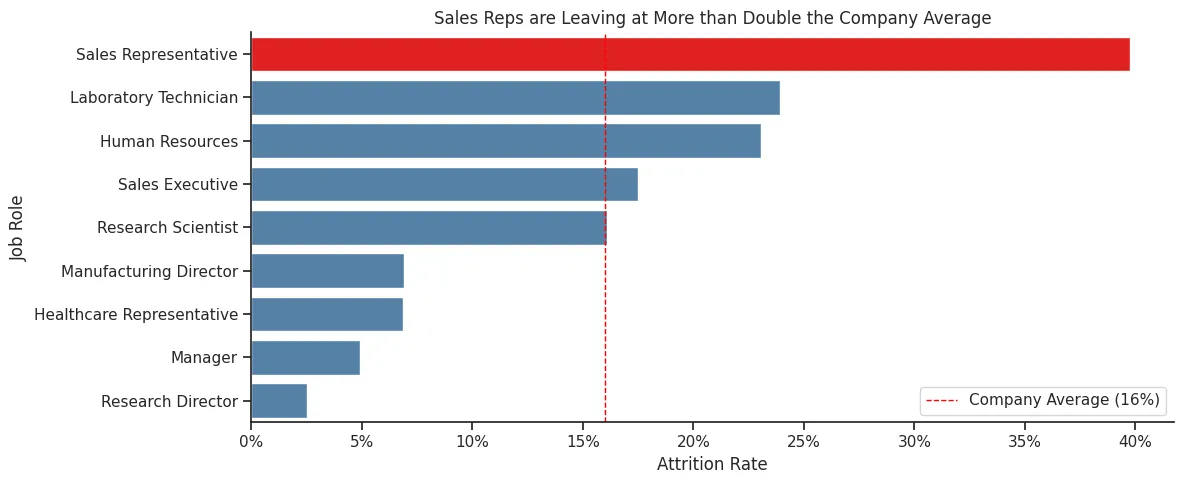
The first cut is the most striking. Sales Representatives are leaving at 39.8% — roughly two and a half times the company average. Laboratory Technicians and Human Resources follow at 24% and 23% respectively. At the other end, Research Directors leave at 2.5%, Managers at 4.9%.
The spread isn’t subtle. Sales Reps are leaving at a higher rate than the five lowest-attrition roles combined. Whatever’s happening in those three high-attrition roles isn’t a small marginal effect — it’s the dominant signal in the dataset.
A reasonable HR leader looking at this chart would immediately want to know what these three roles have in common.
Finding 2: People who leave earn substantially less
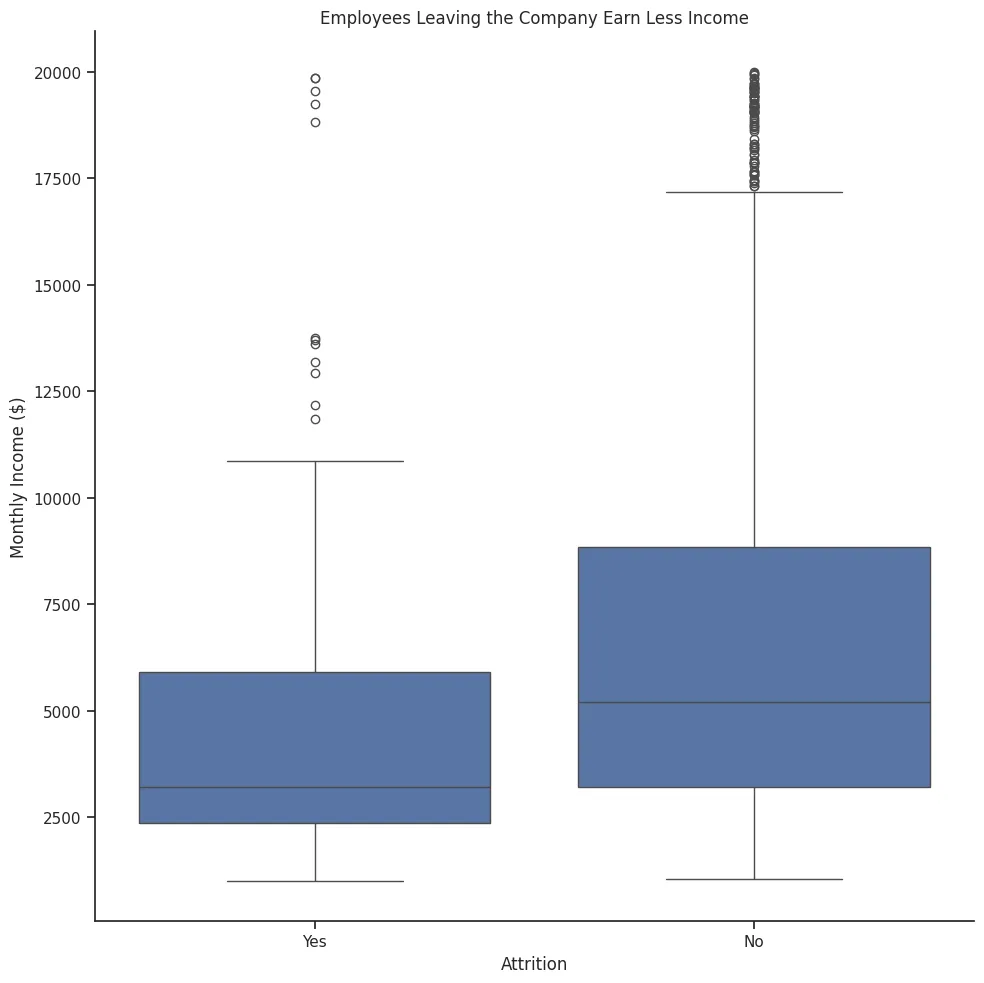
The compensation pattern is exactly what you’d expect, with one twist. The median monthly income of employees who left is roughly equal to the 25th percentile of employees who stayed — meaning a typical leaver earns about as much as the bottom quarter of the people who stuck around. The 25th percentile of leavers is below $2,500/month.
The twist is in the outliers. There are clearly people earning $15,000+ per month who still left the company. So compensation isn’t the only factor driving attrition — but it’s a meaningful one, and it correlates with the role pattern from Finding 1.
Finding 3: Overtime triples attrition risk
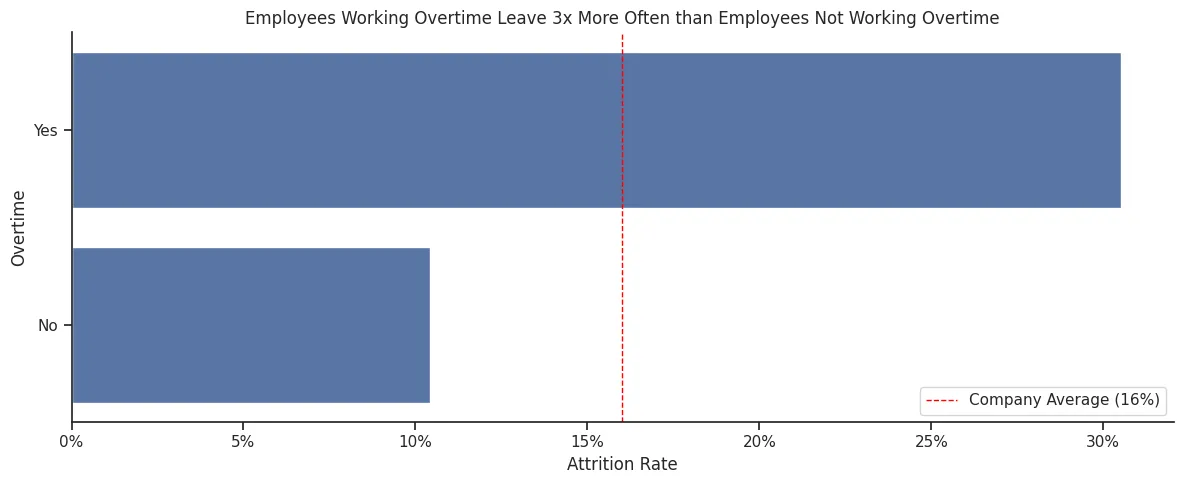
Across the whole company, employees who work overtime leave at 30.5%, almost three times the rate of employees who don’t (10.4%). Said differently: the act of working overtime is the single most predictive variable in this dataset for whether an employee will leave.
This is where the analysis starts to converge on something actionable. Overtime is a controllable variable. Compensation is also controllable, but it’s slow to change and politically expensive. Overtime is something a manager can adjust next quarter.
Finding 4: Within roles, overtime is devastating
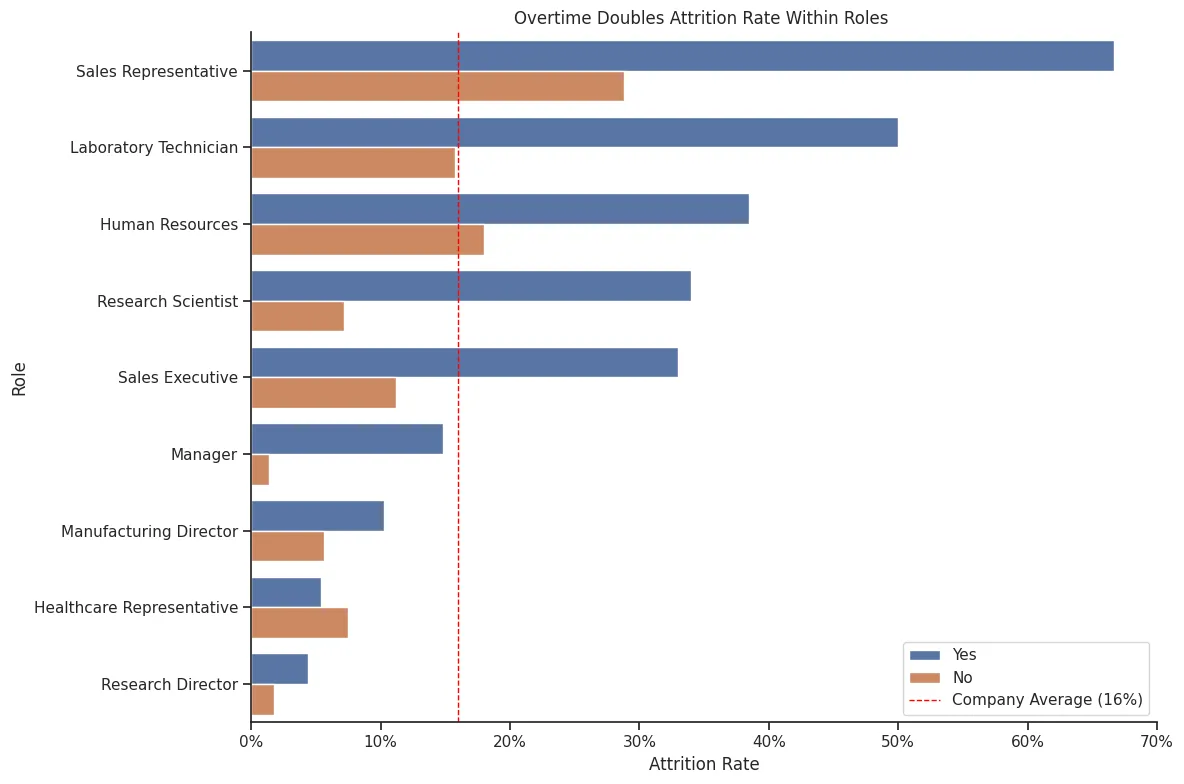
This is the chart that ties the analysis together. The high-attrition roles aren’t just losing people generally — they’re losing people working overtime at catastrophic rates:
- Sales Representatives + overtime: 66.7% attrition. Two out of three Sales Reps working overtime will leave.
- Laboratory Technicians + overtime: 50% attrition. One in two.
- Human Resources + overtime: 38.5%.
Compare those to the same roles without overtime. Lab Techs without overtime sit at 15.7% — actually below the company average. The role itself isn’t the problem; the role with overtime is.
For Sales Reps the picture is more complicated. Even without overtime, attrition is 28.8% — well above company average. So overtime is an aggravating factor for Sales, but there’s clearly something else going on in that role.
Finding 5: The high-attrition roles also show the shortest tenure
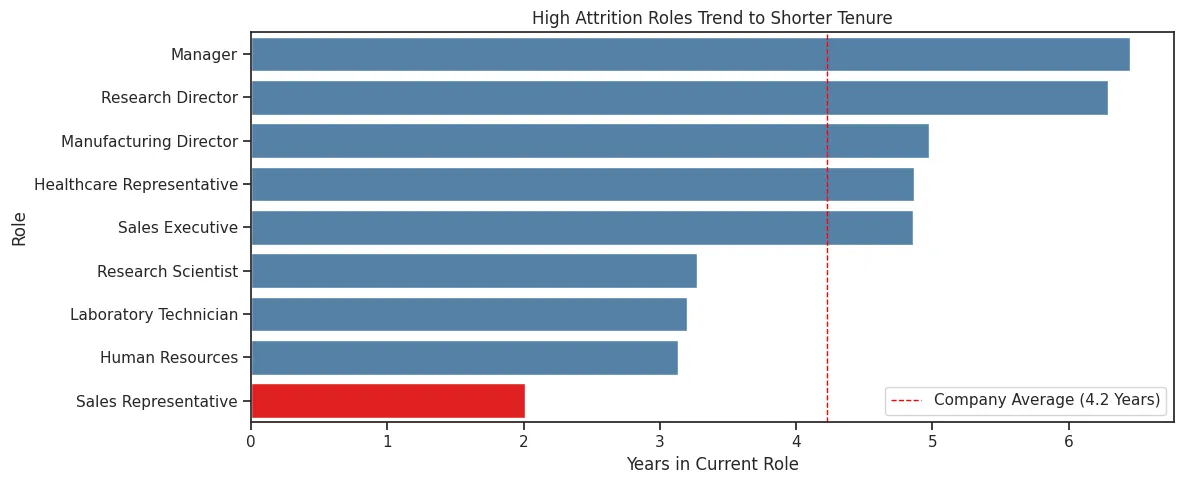
The last cut is the most diagnostic. Sales Reps average 2.0 years in their current role — less than half the company average of 4.2 years. Human Resources and Lab Techs follow at around 3.1–3.2 years.
Combine this with the attrition rates from Finding 1 and a clearer picture emerges: these aren’t roles where people stick around long enough to get promoted. The high-attrition roles are also low-tenure roles, which strongly suggests employees in these positions don’t see a future inside the company. They’re churning to other companies, probably for the same role at higher pay or with better conditions.
What HR leadership should do
Three recommendations fall out of the analysis, ordered by feasibility:
1. Audit overtime policy in the three high-attrition roles immediately. Sales Reps and Lab Techs working overtime are leaving at 67% and 50% respectively. Whatever the business reason for that overtime, the cost of replacing two-thirds of the Sales team annually almost certainly exceeds the marginal value of the extra hours. The first action is a hard look at whether overtime in these roles is essential or convenient — and a target reduction in non-essential overtime.
2. Build internal mobility pathways for Sales Representatives. Sales Reps are leaving regardless of overtime status, just at higher rates with overtime. Combined with their below-average tenure, the most likely explanation is that they don’t see a career arc inside the company. A formal promotion pathway from Sales Rep into Sales Executive (or lateral options into other roles) would address the structural issue.
3. Compensation review for the three high-attrition roles. Slower to implement, more expensive, and probably necessary. The income gap between leavers and stayers is not subtle, and the high-attrition roles cluster at the lower end of the pay distribution.
Limitations
A few important caveats:
- The dataset is synthetic. IBM created it for analytical exercises like this one, not from real company operations. The patterns within it are realistic, but the specific numbers shouldn’t be cited as benchmarks.
- Cross-sectional, not longitudinal. I can identify correlations but can’t establish causation. “Overtime causes attrition” and “the kinds of conditions that lead to overtime also lead to attrition” produce identical patterns in this kind of data.
- Even without overtime, Sales Reps still leave at 29%. That’s nearly double the company average. There’s at least one substantial factor driving Sales attrition that this dataset doesn’t capture — maybe industry pay competitiveness, maybe management quality, maybe sales quotas. A real HR analysis would need either more variables or a follow-up study.
Reflection
What I took from this project: the hardest part wasn’t running the analysis — pivot tables and groupby statements found the patterns quickly. The hardest part was deciding which findings deserved their own chart and which were noise. I started with a dozen exploratory plots covering job satisfaction, work-life balance, age, distance from home, years at company. Most of them showed weak or noisy patterns. The five charts that made it into the final report were the ones that compounded into a single coherent narrative: high-attrition roles share the same combination of low pay, high overtime exposure, and short tenure.
Cutting nine plots from a fifteen-plot exploration is harder than making the original fifteen. But that editing is what separates a notebook from a report.