Why this project
Formula 1’s 2026 regulations are the largest technical rule change in over a decade — new chassis dimensions, active aerodynamics, a 50/50 power split between combustion and electric, and a shift to fully sustainable fuel. The practical question for a fan or analyst is simple: what do these changes actually do to lap times, corner speeds, and competitive order? The underlying data exists publicly via F1’s live timing system. It just needs to be pulled, cleaned, and visualized.
The stack
- FastF1 — an open-source Python library that wraps F1’s live timing API and provides lap-level telemetry (speed, throttle, brake, gear, DRS) at 10+ samples per second
- Pandas for data shaping
- NumPy for numerical work
- Matplotlib (with occasional Seaborn) for visualization
- Jupyter notebooks for exploratory work, with the reusable pieces extracted into a pipeline module
What the pipeline does
Three stages:
1. Extract. Given a season and event (e.g., “2026 Australian GP”), the pipeline pulls the session data via FastF1’s cached API, gets telemetry for specified drivers or teams, and pulls reference data like tire compounds, weather, and track status flags.
2. Transform. FastF1 returns telemetry at variable sample rates depending on the data source. The pipeline resamples to a common grid, aligns traces by distance-into-lap rather than timestamp (so two different laps of the same circuit compare meaningfully), and computes derived metrics like minimum corner speed, percentage of lap at full throttle, and sector-level time deltas.
3. Visualize. The pipeline produces comparison charts year-over-year and driver-over-driver, suitable for both quick reads and deeper analysis.
What the 2025-to-2026 data actually shows
Round 1 of the 2026 season at Albert Park in Melbourne provided a clean apples-to-apples comparison against the same event in 2025. The same circuit, similar weather window, same top-five teams — but a completely different car regulation underneath.
Lap times
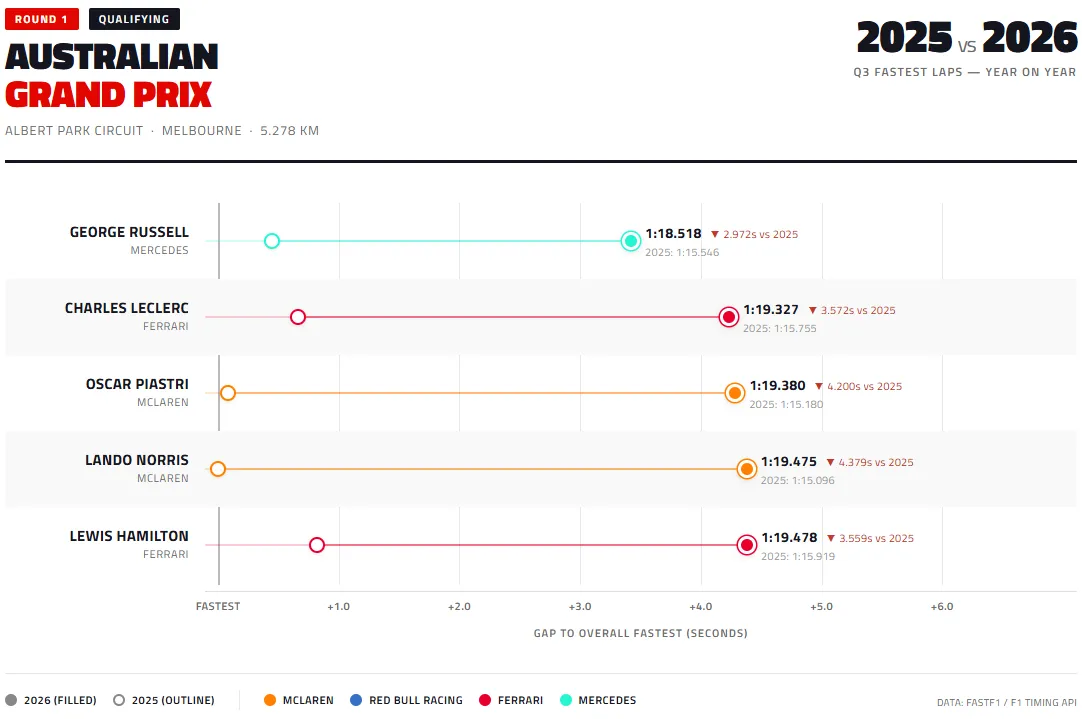
The 2026 cars are significantly slower. Russell, who set the overall fastest Q3 time, lost nearly 3 seconds to his 2025 benchmark. The McLaren drivers — who were strongest at this circuit in 2025 — gave up over 4 seconds each. The regulation change cost every top-five driver between 2.97 and 4.38 seconds per lap at a 5.3 km circuit.
Top speeds
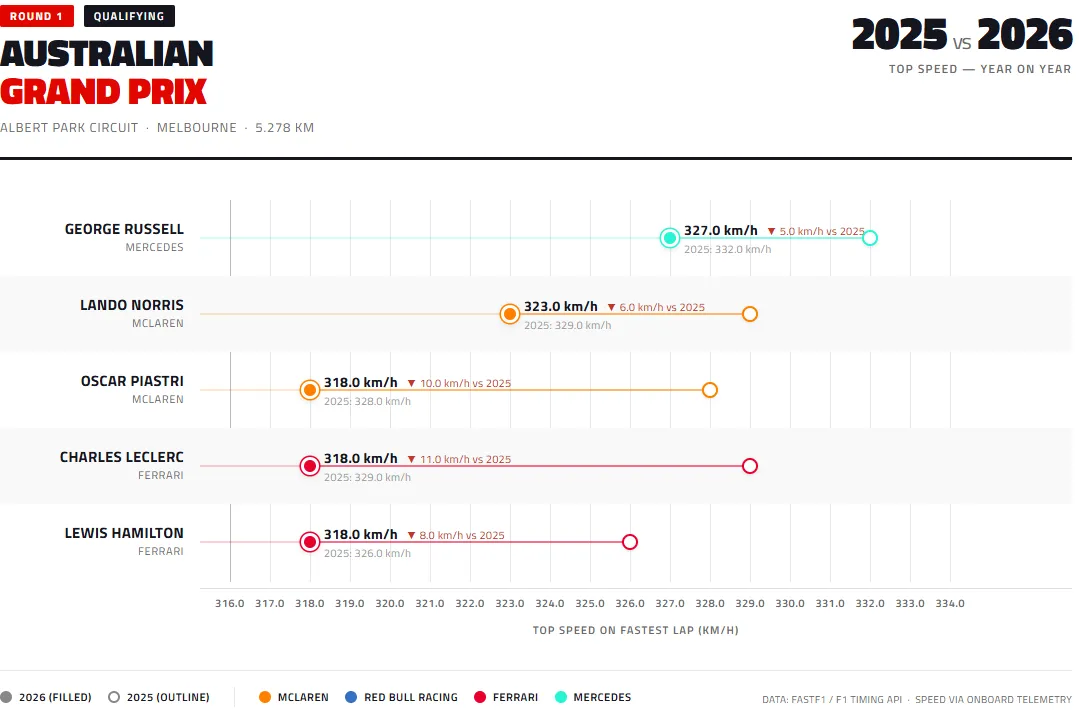
Top speeds dropped across the board. The 50/50 combustion/electric power split, combined with changes to active aerodynamics that replaced DRS, reduced peak velocity on the Albert Park straights. Losses ranged from 5 km/h (Russell) to 11 km/h (Leclerc), with the two Ferraris and Piastri’s McLaren losing the most.
What the two charts say together
The lap-time loss is larger than the top-speed loss alone would explain. That tells us the 2026 cars are also losing time in corners — the new chassis dimensions and reduced ground-effect aerodynamics are making the cars less planted through high-speed sections. A pure straight-line comparison would show the power unit effect; the combined lap-time comparison shows power unit plus aerodynamics.
There’s also competitive reshuffling visible in the lap-time chart. In 2025 Piastri set the session pace. In 2026 Russell does, despite Mercedes not being the dominant 2025 team. Regulation changes often shuffle competitive order, and this first data point is consistent with that pattern.
Why this is a portfolio piece
The project hits three things I want to show:
- End-to-end data pipeline in Python — extract, transform, load, visualize, not just a one-off notebook
- Working with time-series data at 10+ Hz sample rates, with the usual alignment and resampling problems that come with it
- Domain translation — taking raw telemetry and producing visualizations that answer specific, falsifiable questions
What’s on GitHub
The public repo at github.com/jakeb7757 holds the pipeline module, Jupyter notebooks for the individual analyses, and example output charts. The code is deliberately written to be readable rather than maximally clever — function signatures that explain what they do, separation of data fetching from analysis from visualization, and cached API responses so re-running a notebook doesn’t hammer the F1 servers.
Reflection
What the project taught me: the hardest part of any data pipeline isn’t the data, it’s the small decisions about how to handle edge cases — laps with pit stops partway through, sessions interrupted by red flags, drivers who didn’t complete a representative lap. These aren’t exciting, but they’re where hobbyist-level work and portfolio-quality work diverge. The pipeline documents every decision it makes about what to include, exclude, or impute, so when an output looks weird, there’s a clear trail back to why.