The question I started with
There’s a widely-repeated claim that “Tornado Alley” — the traditional strip running from Texas up through Oklahoma, Kansas, and Nebraska — has shifted east over the past few decades, with the worst tornadoes now hitting the Deep South more often. I wanted to test it against 75 years of NOAA data.
The dataset was 71,813 recorded tornadoes from 1950 through 2024, each with location, magnitude, injuries, fatalities, path length, and width. The analytical question was narrow: has the geographic distribution of violent (F4+) tornadoes meaningfully shifted in the post-2000 era compared to the full historical record?
The first pass
I filtered to violent tornadoes (F4 or greater), grouped by state, and computed two rates:
- All-time rate: violent tornadoes per year for each state, 1950–2024
- Post-2000 rate: same calculation, but restricted to 2000–2024
The difference between these rates — positive means the state has seen a higher rate of violent tornadoes recently than its historical average — is the signal I was looking for.
Filtering to states with at least 15 violent tornadoes in the full record (to avoid noise from rare events in states that essentially don’t get F4+ tornadoes), here’s what came out:
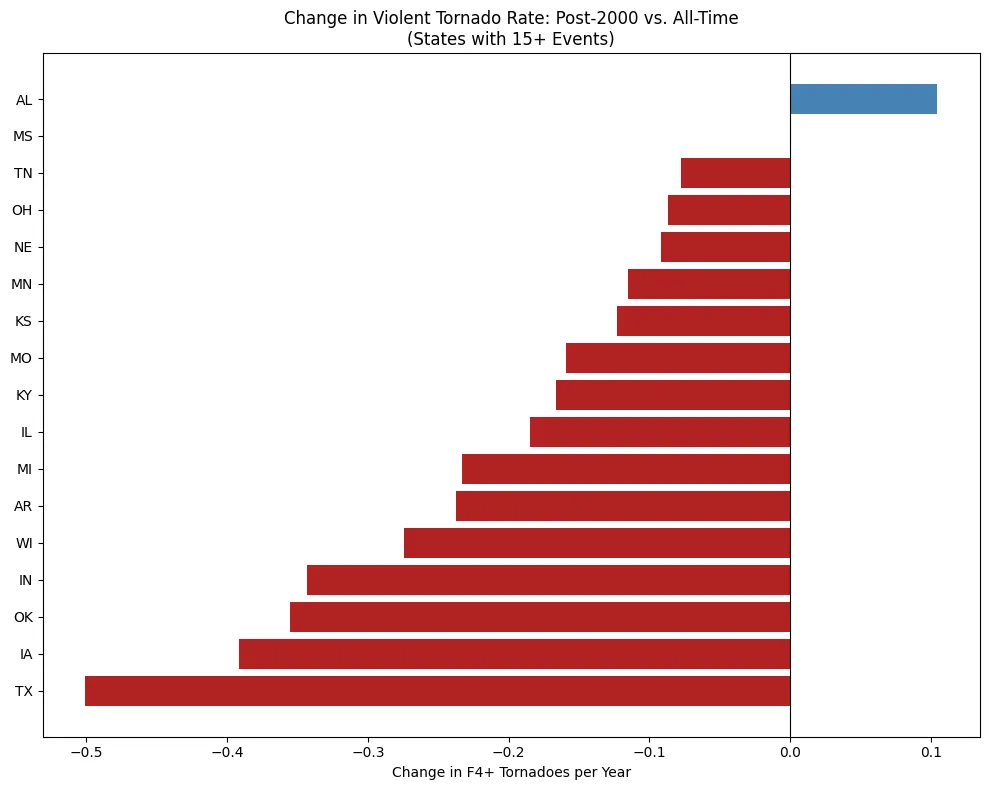
At first glance this looked like evidence against the “Tornado Alley has shifted east” hypothesis — classic Alley states (Texas, Oklahoma, Iowa, Kansas, Nebraska) are all showing dramatic decreases in their violent tornado rates. Meanwhile the only clearly positive bar was Alabama. The Deep South was mostly flat or slightly negative: Mississippi basically unchanged, Tennessee down, Louisiana down.
Interesting finding. Except I wasn’t sure it was a finding yet.
Alabama is the whole story, and Alabama is one bad day
I pulled up Alabama’s violent tornado counts year by year and saw this:
2011    9
2010    1
2008    2
2007    2
2001    1
2000    1
Nine violent tornadoes in 2011. Every other year in the 21st century had at most two. That’s the April 2011 Super Outbreak — the deadliest tornado outbreak in U.S. history, which dropped several EF4 and EF5 tornadoes on Alabama in a single day.
If I remove 2011 from Alabama’s data entirely, the post-2000 count drops from 17 to 8. Over 24 years that’s 0.33 violent tornadoes per year — below Alabama’s all-time rate of 0.58. The apparent eastward shift in my first chart was almost entirely one extreme event bleeding into an averaged metric.
Here’s the same chart with 2011 excluded from Alabama’s count:
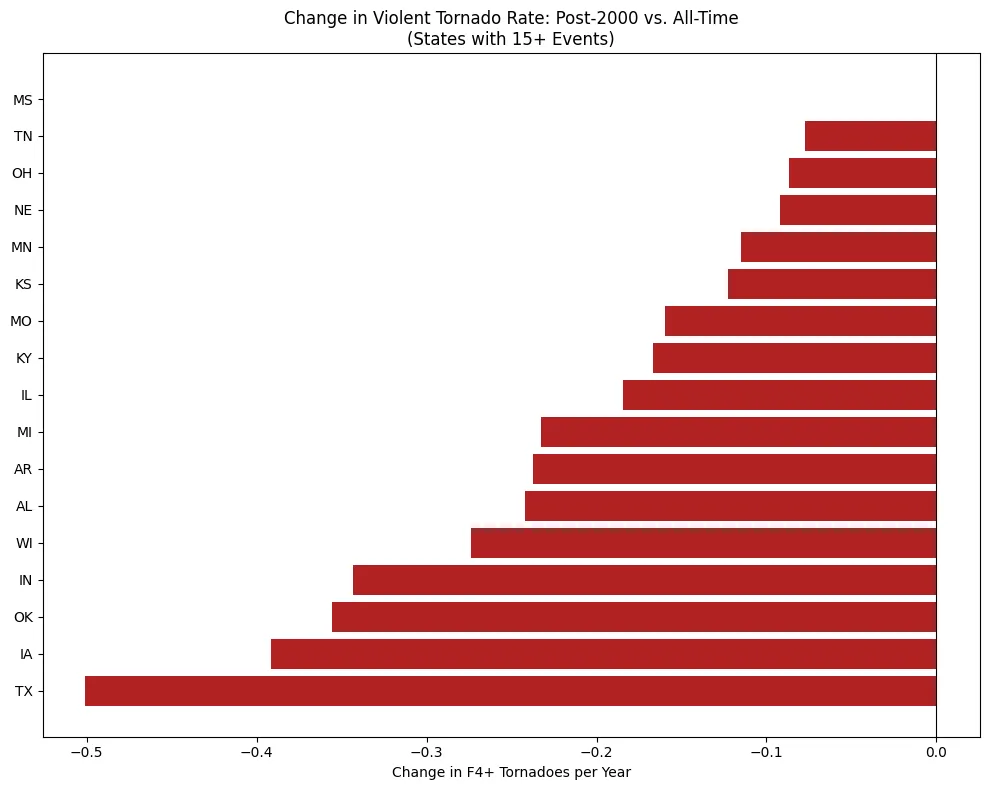
Now every state in the sample shows a decrease. Texas is still down 0.5 events per year. Iowa, Oklahoma, Indiana, Arkansas, Wisconsin — all down. The cleanest read of this chart isn’t that Tornado Alley shifted; it’s that violent tornado counts are broadly lower across every high-activity state since 2000.
That’s not the story I went looking for. It’s a more interesting one.
The real question: why did violent tornadoes drop?
The obvious follow-up question — do fewer violent tornadoes actually happen now, or has something changed about how they’re measured? — led me to an important piece of context. In February 2007, the U.S. switched from the Fujita scale to the Enhanced Fujita scale for rating tornadoes. The EF scale uses different damage indicators and generally classifies tornadoes more conservatively than the F scale did. A storm that would have been rated F4 in 1990 might be rated EF3 today for the same level of observed damage.
So “there are fewer violent tornadoes now” could mean:
- There actually are fewer (climate or atmospheric factor shift)
- The same storms are being rated lower (measurement change)
- Both (real decrease and tighter rating)
This chart compares violent tornado counts by state between the F-scale era (1950–2006, 57 years) and the EF-scale era (2007–2024, 18 years):
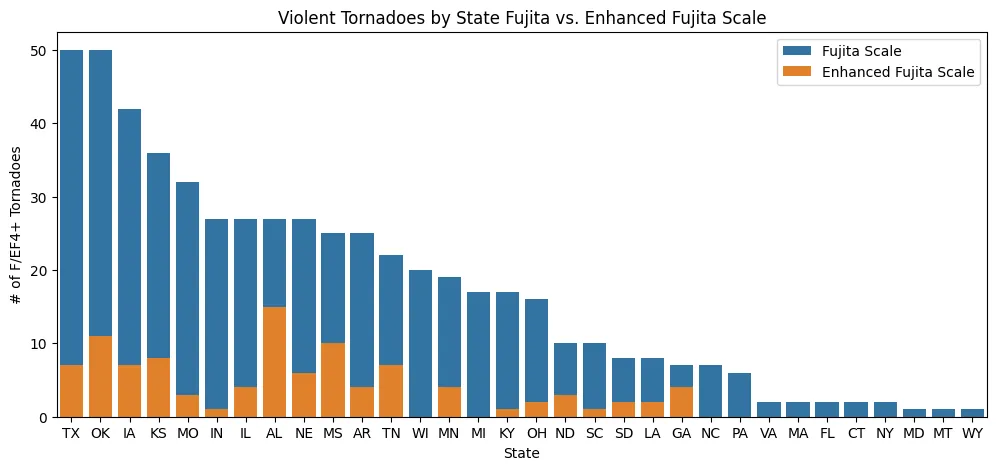
The chart is hard to read directly — the F era covers 57 years and the EF era covers 18, so raw counts can’t be compared without normalizing. But the visual disparity is telling. Even accounting for the window difference, the EF-era counts look proportionally smaller across most states. A proper follow-up would compute violent tornadoes per year in each era, state by state, to quantify how much of the drop is measurement change and how much is something else.
What I’d do next
The project is a starting point, not a conclusion. To actually answer “did violent tornadoes decrease, or did the rating scale get stricter?” I’d want:
- Per-year violent tornado rates in both eras, computed state by state, to quantify the effect size
- A comparison against damage-based metrics (injuries, fatalities, loss in dollars) that don’t depend on the rating scale — if actual storm destructiveness has decreased in proportion to the rating drop, that’s evidence of real decrease; if destructiveness held steady while ratings dropped, the shift is in the measurement
- A look at EF scale recalibration events — the NWS has revised EF criteria a couple of times since 2007, and those revisions may create structural breaks in the series
None of that is in this project. It’s the obvious next step.
What I took from this
Two things stood out as I worked through it.
First, single events distort everything. Alabama’s 2011 Super Outbreak was a 1-in-70-years event that single-handedly flipped Alabama from “slight decrease” to “only state showing an increase” in my first chart. If I’d stopped at the first chart and written up “Tornado Alley is shifting east,” I’d have been wrong in a way that’s hard to see without going back to the raw year-by-year data. Rate comparisons over short windows need to be stress-tested by looking at the underlying distribution.
Second, the most honest finding from this project isn’t a conclusion — it’s a better-framed question. I started out asking “did Tornado Alley shift east?” (answer: probably not in any meaningful sense) and ended up at “how much of the apparent drop in violent tornadoes is real versus a measurement artifact?” That second question is more analytically interesting and actually answerable. I’d rather end a project with a sharper question than with a premature conclusion.
Tooling
Built in Python with Pandas, Matplotlib, and Seaborn. Source data from NOAA’s Storm Prediction Center (1950–2024 actual tornadoes dataset). The full notebook is on my GitHub.