The business question
Red River Ski Area in northern New Mexico has operated through four decades of changing climate. The question a small resort’s leadership actually needs answered is narrow and practical: how has warming affected the number of days cold enough to make snow, and what does the trend look like going forward? That single answer shapes decisions about snowmaking equipment investment, seasonal staffing, marketing calendars, and long-term viability.
The data
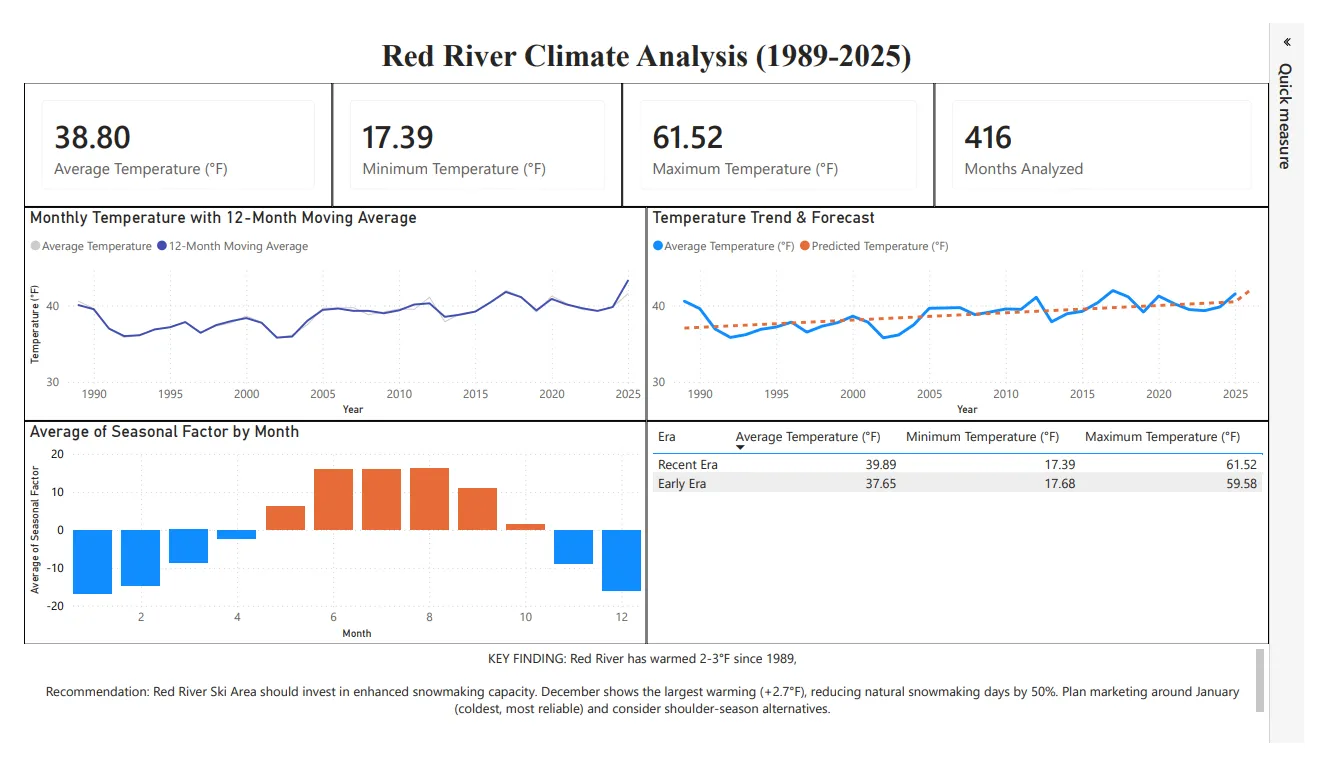
The dataset was 13,455 daily observations from the NOAA weather station at Red River Pass, spanning January 1989 through November 2025 — just under 37 years of continuous record. Each day carried average, minimum, and maximum temperature, along with precipitation and snow depth. The observations were aggregated into 443 monthly records for analysis.
A data quality issue surfaced early: the entire window from July 2002 through August 2003 was missing. Dropping those months outright would have distorted the annual seasonal pattern, so I imputed the gaps using seasonal averages from the surrounding years. This preserved seasonal structure without pretending to know the actual weather during those months.
Method
I worked the problem in five phases:
- Aggregation. Daily observations rolled up into monthly averages via pivot tables.
- Smoothing. I built both 3-month and 12-month moving averages — the 3-month preserves seasonal transitions while reducing noise; the 12-month strips seasonality out entirely to expose the underlying trend.
- Decomposition. Additive decomposition separated the series into trend, seasonality, and remainder. Seasonal factors were calculated by averaging detrended values across all 37 years.
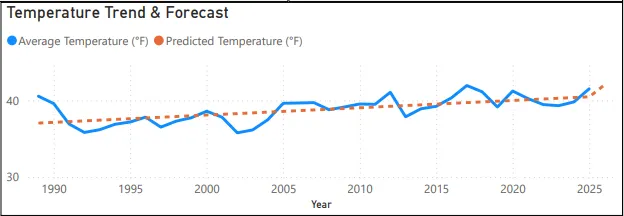
- Regression. A multiple regression model with time (in months) as a continuous predictor and 11 monthly dummy variables (January as reference) to capture the seasonal cycle.
- Forecasting. The fitted model projected monthly temperatures through November 2026.
Findings
The warming trend is clear, consistent, and statistically significant. Average temperatures rose from 37.65°F in the Early Era (1989–2006) to 39.89°F in the Recent Era (2007–present) — a 2.24°F increase. The regression model explained 92.95% of temperature variation (R² = 0.9295) with an F-statistic of 472.44 (p < 0.001). The time coefficient — 0.00795°F per month, or 0.095°F per year — is the quantified warming rate.
Translated into operational terms, the comparison between eras was sharper than expected:
- 205 fewer days below 32°F in November (recent vs early era)
- 317 fewer days below 32°F in December
- A roughly 50% reduction in natural snowmaking days through early season
December saw the largest monthly warming (+2.7°F) — meaningful because December is when the resort counts on building a reliable base.
Forecast through 2026
The model projected:
- December 2025: 24.46°F
- March 2026: 31.91°F
- August 2026 (peak): 56.86°F
Standard error was ±3.478°F, meaning 95% of actual outcomes should land within roughly 7°F of the prediction. That’s tight enough to plan multi-month operational decisions around.
Recommendations
Three actions fell out of the analysis:
1. Expand snowmaking infrastructure, weighted toward early season. The 50% reduction in natural snowmaking days in November and December means the resort’s opening conditions increasingly depend on artificial snow. Investment priority should be energy-efficient equipment sized for early-season demand.
2. Shift marketing calendar toward mid-season reliability. November temperatures averaged 1.8°F warmer in the recent era. Rather than promoting Thanksgiving-through-April, positioning Red River as a mid-December through March destination better matches actual reliable snow windows. Pass pricing could specifically incentivize January–February visits.
3. Plan for the 35-year horizon. If 0.095°F per year continues, the 2060s bring another 3–4°F of warming on top of what’s already occurred — cumulative 6–7°F from 1989. This isn’t an emergency, but it’s a scenario worth diversification planning for: summer recreation, higher-elevation expansion, or adjacent revenue streams.
Reflection
The value of this analysis wasn’t in discovering that climate has warmed — that’s well established. It was in translating an abstract 2°F trend into concrete, quantified operational metrics: fewer cold days, narrower operating windows, specific forecast temperatures for specific months. A decision-maker can act on “205 fewer days below freezing in November” in a way they can’t act on “things are warmer now.”