The question
If you’re planning a new retail location, or allocating promotional budget across an existing portfolio of 45 stores, which variables actually predict weekly sales — and how confidently? Intuition says store size matters, holidays matter, and macroeconomic conditions matter. Statistical modeling lets you put numbers on each.
The data
Three raw datasets from a Walmart case study:
- Sales: 421,571 weekly sales records by store and department
- Stores: 46 stores with type, size, and metadata
- Features: 8,191 weekly observations of external factors — temperature, fuel price, markdowns, CPI, unemployment, and holiday flags
Data quality came first
Before any modeling, I ran a data quality audit using COUNTA, COUNTIF, and range checks across all three datasets. The audit surfaced issues that would have corrupted the model if ignored.

Breaking down the Sales and Features issues:
- 1,285 negative sales values (likely returns coded as sales)
- 1,065 missing date values in the Sales dataset
- 24,034 missing markdown and CPI values in Features — heavy “NA” in promotional columns because markdowns didn’t exist systemwide until 2011
The cleaning approach varied by issue. Negative sales were excluded as non-comparable to regular weekly revenue. Missing markdown values were imputed to zero (reasonable, since an absent markdown functionally equals no promotion). Missing CPI and unemployment were carried forward from the most recent available observation.
After cleaning and aggregating sales to the store-week level, the analytical dataset held 430 store-weeks with complete predictors — enough power for regression while keeping the model focused on a clean subset of the data.
Simple regression: store size alone
The first model used just store size as a predictor:
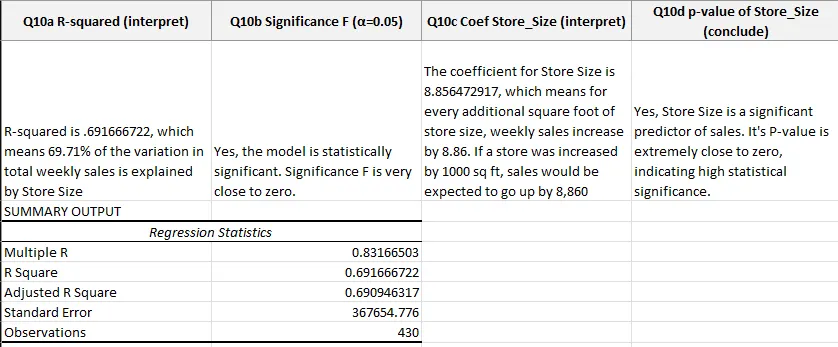
- R² = 0.6917 (69.17% of sales variation explained by store size alone)
- Coefficient on store size: 8.86 (each additional square foot predicts $8.86 more in weekly sales)
- Significance F: 2.07e-111 (effectively zero — the relationship is real)
- Standard error: $367,655
The practical read: every additional 1,000 square feet predicts roughly $8,860 in incremental weekly sales. Useful for sizing new stores, but with 31% of variation unexplained, there’s clearly more to the story.
Multiple regression: adding context
The second model added temperature, total markdowns, unemployment, and a holiday indicator:
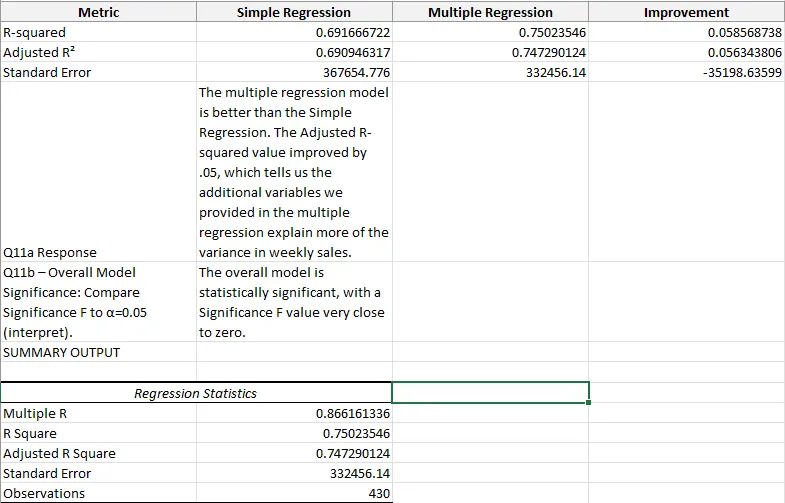
Adding four variables lifted R² by 5.86 percentage points and cut standard error by $35,198. The improvement isn’t dramatic, but it’s meaningful: every unexplained variable the model can actually account for tightens forecasts for downstream decisions like inventory planning and staffing.
What the model says
The findings with clearest business implications:
- Store size is dominant. The store-size coefficient barely moved when other variables were added, meaning size genuinely drives most sales variation.
- Holidays lift sales. The holiday coefficient was positive and significant — a quantifiable bump worth planning around.
- Markdowns correlate positively with sales, but the direction of causality is ambiguous. Do promotions lift sales, or are promotions placed where sales were already expected? The regression alone can’t answer; a controlled experiment would.
- Unemployment is negatively correlated with sales, matching economic intuition — lower household income, less retail spending.
What the model can’t tell you
Any regression analyst’s job includes knowing the model’s limits. Things this one doesn’t address:
- Store location effects aren’t in the feature set. Two 150,000 sq ft stores in different markets will have different sales floors, and the model treats them identically on size alone.
- Seasonality is partially captured through the holiday flag but not through month-of-year fixed effects. A richer model would add those.
- Department mix within stores isn’t modeled. A grocery-heavy store and an apparel-heavy store of the same size serve different demand curves.
Reflection
The real lesson wasn’t in the final R² number. It was in how much the data quality audit shaped what was possible. A 24,058-issue dataset, if modeled naively, produces regression coefficients that look statistically significant but mean nothing. Spending the first phase on cleaning — and documenting which issues were resolved which way — is what makes the rest defensible.